#1 TikTok Ads Spy Tool

A Better Way to Make TikTok Ads Dropshipping & TikTok For Business

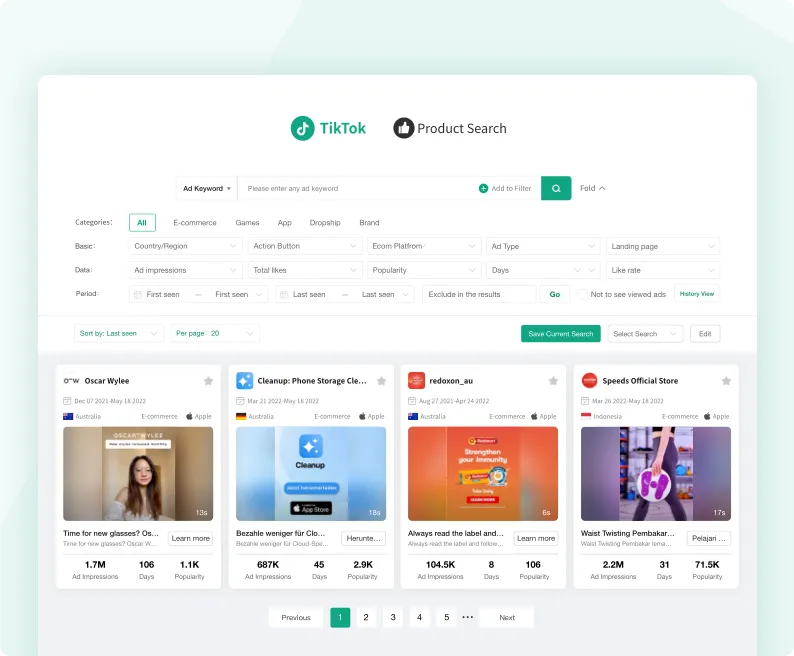
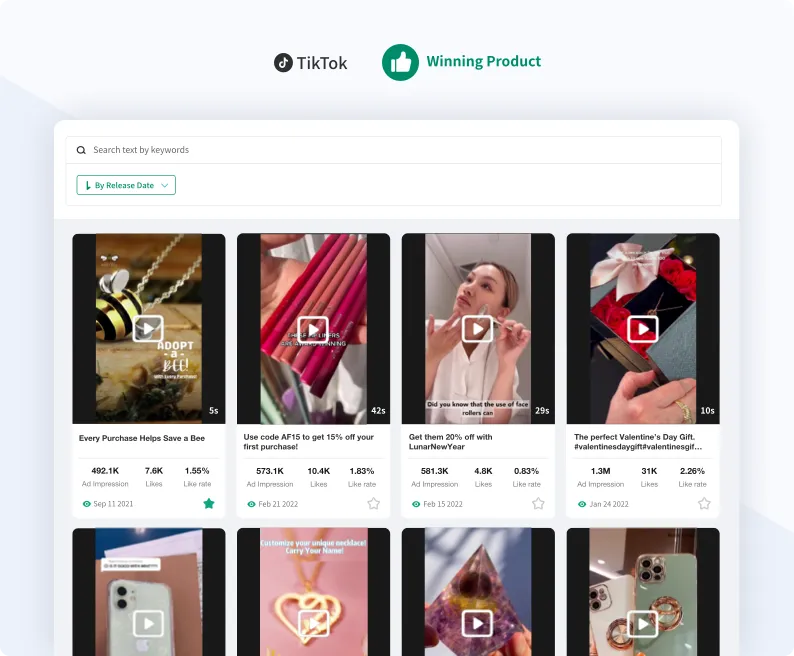
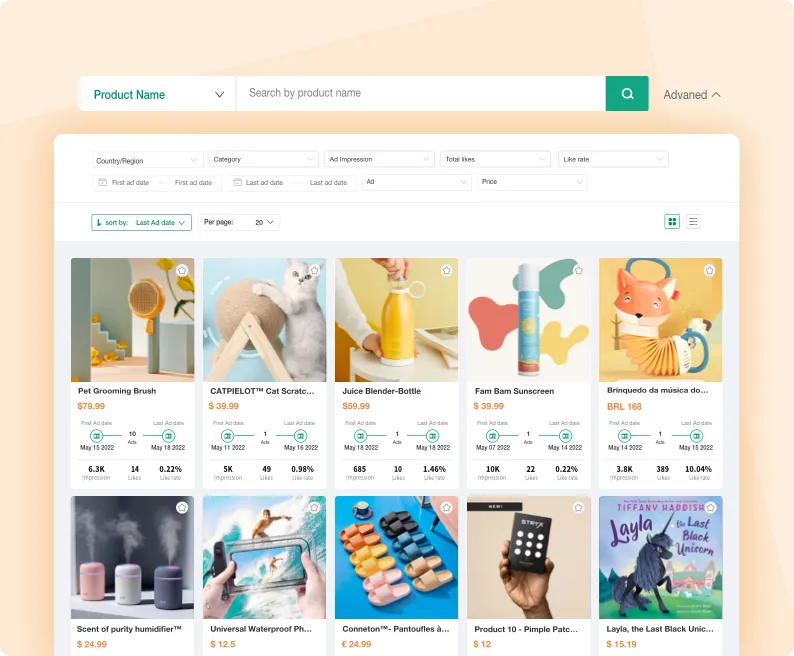
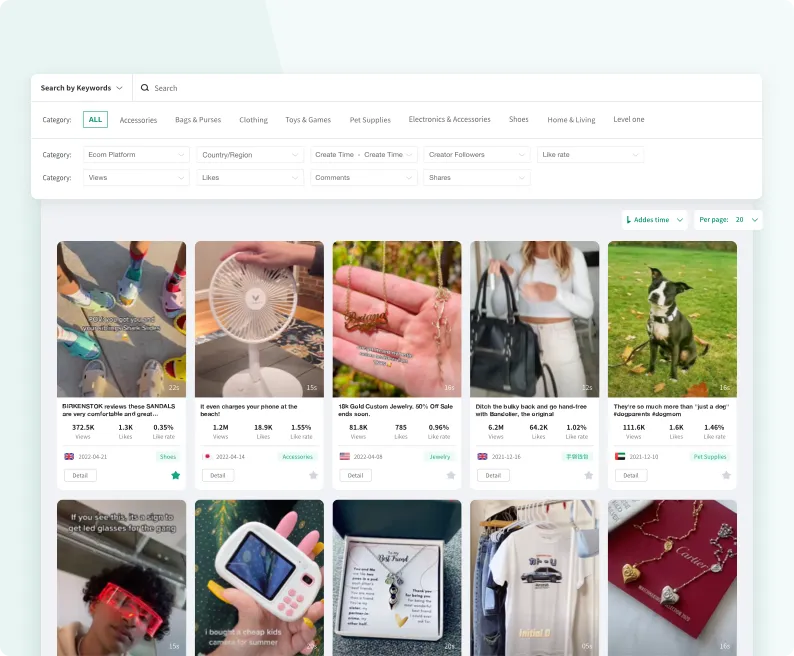
  • Find TikTok winning products & TikTok dropshipping ads.
  • Analyze TikTok advertisers
  • Get the Latest TikTok Shop Data.
Try It Free

facebook ads reporting tools

Published on: January 31 2023 by pipiads

In this article, we will discuss how to create a Facebook ad report for clients using a free Facebook ads reporting tool. The tool is available in Facebook Business Manager and Ads Manager.

Creating a Facebook Ad Report:

1. Go to the old tools section in Business Manager and find the Ads Reporting section.

2. Turn off the ad blocker and click on Create Report.

3. Choose the Facebook account and name the report.

4. Customize the table by selecting metrics and breakdowns.

5. Adjust the filter by selecting time and campaign.

6. Share the report by saving, exporting, or copying a link.

7. Use the data to create tables and graphs.

Creating a Facebook ad report for clients is an easy process using the free Facebook ads reporting tool. By customizing the table and adjusting the filter, you can select the metrics and breakdowns that matter most to your client. Sharing the report is easy through saving, exporting, or copying a link. Finally, you can use the data to create tables and graphs to further analyze the ad campaign's performance.

A Peak Inside My Facebook Ads Reporting Template...

In this article, we will discuss the importance of having a solid reporting format for your clients. We will explore a reporting template that you can use to communicate the story behind the data effectively. This template has been designed on Canva and can be exported to Google Slides for easy sharing with clients. We will also highlight the use of Varos, a benchmarking software that allows you to compare your metrics to other companies in your industry.

Why is reporting important?

If you work with clients, having the right reporting template can go a long way in communicating the story behind the data. Not having a solid reporting format was one of the biggest complaints that clients had throughout my career. By fixing this reporting format and committing to it, we have been able to retain clients longer. Additionally, having the right type of reporting format forces the people who are working on the strategy or on the execution of the account to actually step back and analyze that data.

The Reporting Template:

Title Page: The title page should have the client name, date, and other logos for other platforms if applicable.

Agenda: The agenda should be self-explanatory and should be shared with the client a day or so before the meeting.

Performance Metrics: It is important to zoom in on the performance numbers and give an overall baseline for what happened in the account that month. This section should highlight the most recent last 30 days data and the previous 30 days so that you can draw a comparison and notice trends that are happening throughout the account over the last 60 days. You can highlight metrics such as CPA, overall purchases, hook rates, and frequency.

Varos Benchmarking: Varos is a benchmarking software that allows you to anonymously compare your metrics to other companies in your industry. This section should highlight how your metrics compare to your competitors in terms of CPMs, cost per purchase, ROAS, click-through rates, and other metrics.

Highest Performers: This section should highlight the highest performers in the month or year and provide a preview link so that anyone looking at this report can go and see the actual asset, amount spent, purchases, CPA, click-through rate, and hook hold.

Having a solid reporting format is crucial for retaining clients and effectively communicating the story behind the data. The reporting template discussed in this article can be customized to fit your unique use case and can be easily shared with clients on Google Slides. Additionally, the use of Varos can provide valuable insights into how your metrics compare to your competitors in the industry.

This NEW Tool Is Key For Ad Reporting!

In this article, we will be discussing a new tool that can help automate your ad reporting process, which we discovered on AppSumo. Two Minute Reports is a software that integrates with Google Data Studio and Google Sheets, offering better pricing than Super Metrics, their main competitor.

Features of Two Minute Reports include:

- Pricing starting at $5 per month

- Connecting two data sources at any given point

- Connecting two accounts per data source

- Integrating with every single app platform that most agencies and brands use

To use Two Minute Reports, simply log in and connect your desired data sources, select the type of source, log in, and connect the actual source. Once you add a new data source, you must go through the same process.

You can either create a report from scratch or use one of Two Minute Reports' pre-made templates, which include Facebook ads overview report for lead gen, Facebook ads overview performance and KPIs, Instagram, and Google Ads versus Facebook Ads.

The beauty of Two Minute Reports is that it updates automatically at the frequency that you choose, giving you a live and running 24/7 reporting dashboard. This can be beneficial for agencies and brands, allowing them to see all of their real data in one place, without logging into the ads manager.

In conclusion, if you're looking for a tool to automate your ad reporting process, Two Minute Reports is a great option to consider. It's affordable, integrates with multiple platforms, and updates automatically.

How To Automate Your Facebook Ads Reporting (Full SuperMetrics Tutorial)

Automating Media Buying Reports with Super Metrics and Google Sheets

If you're a media buyer, you know that creating reports can be time-consuming, especially when you have to do it every month. But there's a solution - automation. In this article, we'll show you how to automate your media buying reports using Super Metrics and Google Sheets.

Benefits of Automation:

- Saves time

- Provides valuable insights

- Builds valuable dashboards

- Easy to use

- Flexible

How to Automate Reports:

1. Use Super Metrics - a Chrome extension plug-in that can pull data from various data sources.

2. Launch the Super Metrics sidebar and select the ad account and date range.

3. Choose the data sources/metrics you want to pull, such as spend, clicks, leads, sales, etc.

4. Use Google Sheets to create a spreadsheet that links to each source of data.

5. Use formulas to automate the data and create reports and dashboards.

6. Duplicate and update the spreadsheet each month.

Automating media buying reports with Super Metrics and Google Sheets can save you time, provide valuable insights, and help you build valuable dashboards. With this simple solution, you can create reports that are easy to use, flexible, and provide valuable insights for your clients. So, why not give it a try and see how it can benefit your business?

Facebook Ads Reporting | How to create Facebook ads reports for clients 2022 | Mohit Hosain

Our team, led by Music Chris (full name not provided), has been managing Facebook ads for your brand to generate higher intended leads. We have implemented various strategies, including multiple audience targeting and dynamic ad creative, and have conducted heavy testing to ensure the best ad set. In this report, we will summarize our campaign results and future plans.

Campaign Summary:

- Campaign period: 7 days

- Budget: $172 AUD

- People reached: 2150

- Click-through rate (CTR): not provided

- Cost per link click (CPC): not provided

Campaign Results:

Our strategies have been successful in achieving the intended leads for your brand. We plan to scale the ads and set up another dynamic creative to further enhance the results. Our cost per result goal is sixth, and we aim to create custom retargeting and lookalike audiences to reduce the ad cost.

In conclusion, our Facebook ads management team has been dedicated to achieving higher intended leads for your brand. We have implemented various strategies and conducted heavy testing to ensure the best ad set. Our campaign results have been successful, and we plan to continue optimizing our strategies for better results in the future.

Google Ads Reporting Tool

Google Ads Reporting Tool: How to Customize Reports and Optimize Campaigns

If you've been advertising with Google Ads, you probably know that there is a lot of performance data in the platform. However, it can be challenging to see all the information you need in one easy view to optimize your campaigns. The good news is that there's a tool in the Google Ads interface called the reporting tool, which allows you to customize reports to see pretty much whatever you need to.

Accessing the Reporting Tool:

There are two ways to access the reporting tool. The first one is by clicking on the reports icon in the main navigation, where you'll find some predefined reports and the full customized report builder. The second way is by going to the reports manager portion of the interface, where you'll have all of your saved reports.

Customizing Your Report:

To start customizing your report, choose the type of report you want to see. The table format is the most common, but you can also create more visual charts like line charts, column charts, scatter charts, or pie charts. You can name your report, choose the date range, and select the rows and columns you want to see. The rows are the different segments or levels of the account you want to see, and the columns are the performance metrics you want to have.

Using the Customization Tools:

There are many customization tools available in the reporting tool. You can add different levels of detail, such as campaigns, ad groups, or ads. You can choose the performance metrics you want to see, such as clicks, impressions, or click-through rate. You can also add other fields, such as device, audience, or shopping products.

Incompatible Fields:

Google will gray out incompatible fields to tell you that they can't be added to the report. You can hide them if that makes it easier for you, but it's better to know which fields are incompatible so you can rethink and re-strategize your report.

The Google Ads reporting tool is an essential tool to optimize your campaigns. With its customization tools, you can see pretty much whatever you need to make informed decisions. Don't hesitate to explore and experiment with different report formats to find the one that works best for you.

HOW TO CREATE FACEBOOK AD REPORT FOR CLIENTS

Hey, what's up guys? Alina here, and welcome back to my channel. In this video, today we're gonna see how to create and export Facebook ad reports for yourself and maybe for your clients. And you don't need any extra tool or website. You don't have to pay anything. This will give you all the data for free. Before we jump into the demo, you know what to do. Subscribe, hit the bell icon, and like this video. Now, let's jump into this.

Creating and Exporting Facebook Ad Reports:

- Log in to your Facebook Ads account.

- Click on the Ads Manager section or the three bars icon.

- Select Ads Reporting.

- Click on the blue button Create Report.

- Name your report and select the filters.

- Choose the breakdown of the data.

- Select the metrics you want to see.

- Customize the data to include or exclude specific campaigns, ads, or objectives.

- Save the report and refresh the data.

- Export the report in different formats or share it with others who have access to your account.

Why Ad Reports are Important:

- Ad reports provide raw data that can turn into insights.

- Ad reports help you analyze what's working and what's not in your ad account.

- Ad reports can improve your ad performance in the future.

Creating and exporting Facebook ad reports is a simple and customizable process that can provide you with valuable insights into your ad performance. By analyzing the data and turning it into insights, you can improve your ad account and achieve better results. Don't forget to check your ad reports frequently and use them to your advantage. Thanks for watching, and I'll see you in the next one. Bye for now!

Start your free trial today!

Try Pipiads free for trial, no credit card required. By entering your email,
You will be taken to the signup page.