#1 TikTok Ads Spy Tool

A Better Way to Make TikTok Ads Dropshipping & TikTok For Business

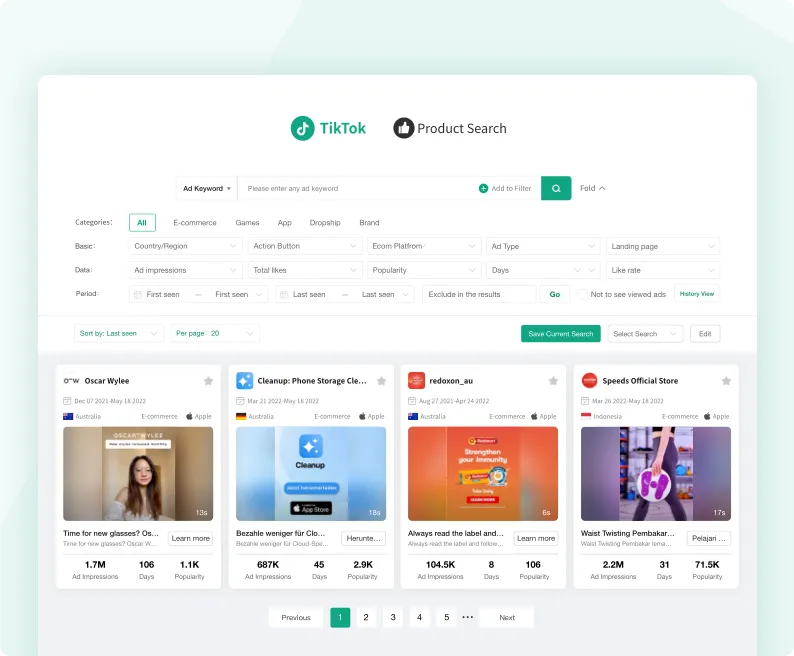
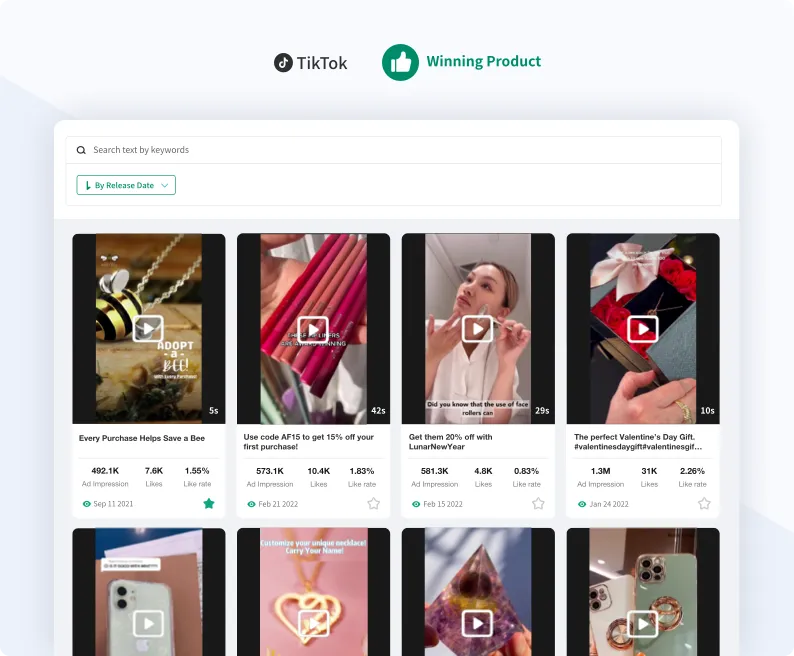
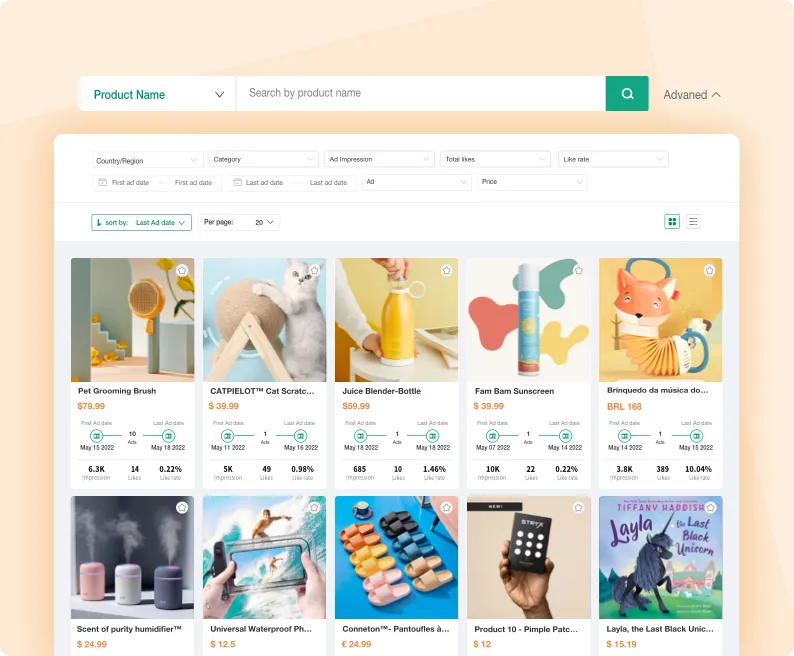
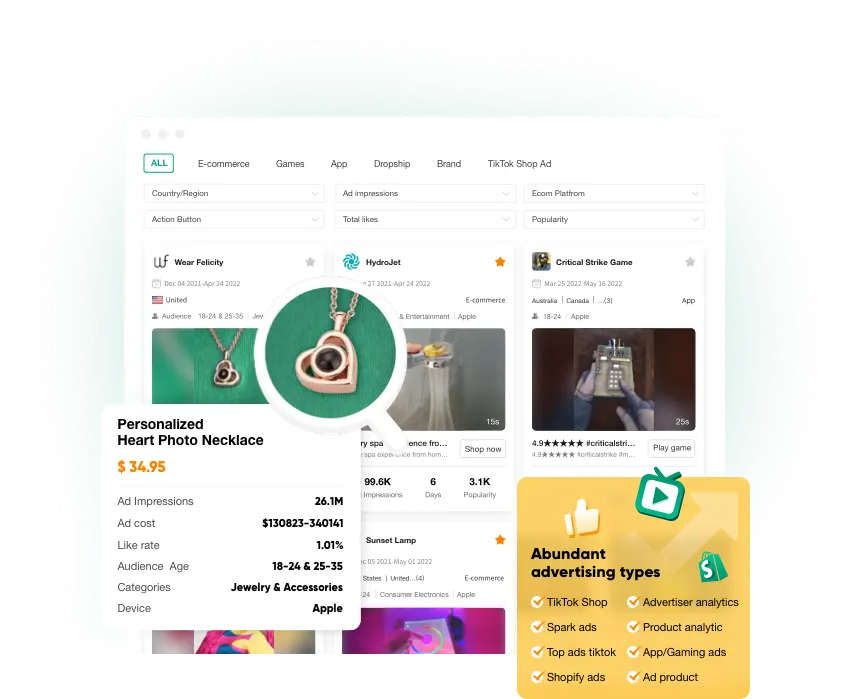
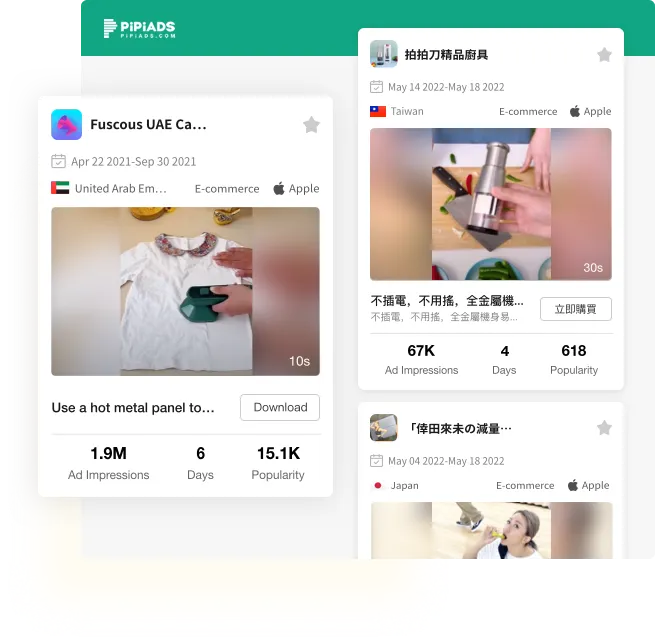
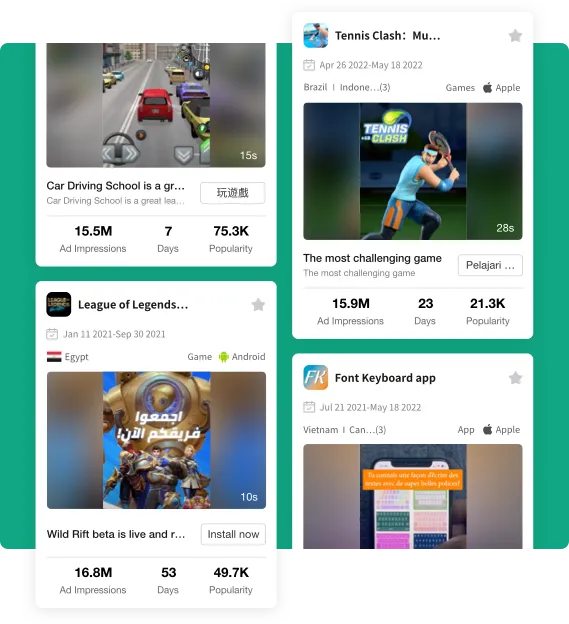
  • Find TikTok winning products & TikTok dropshipping ads.
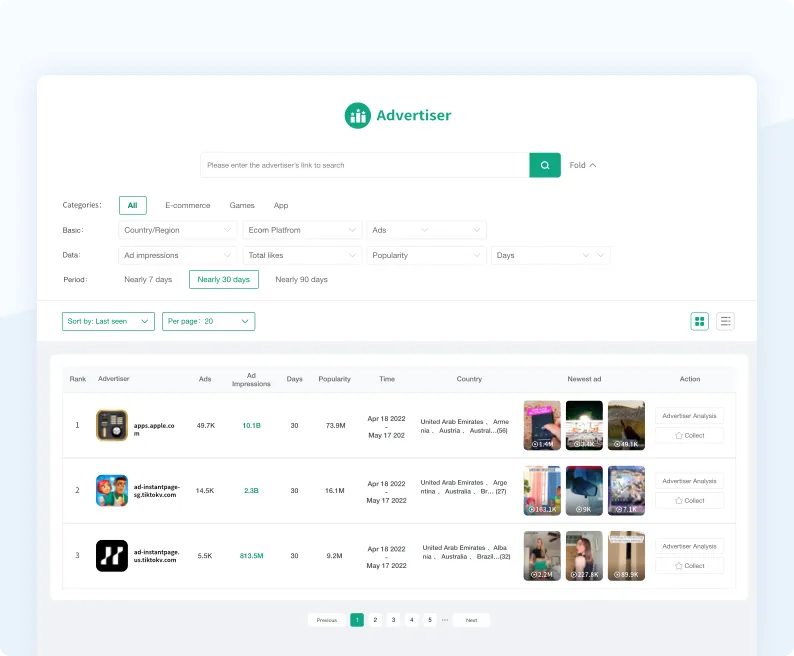
  • Analyze TikTok advertisers
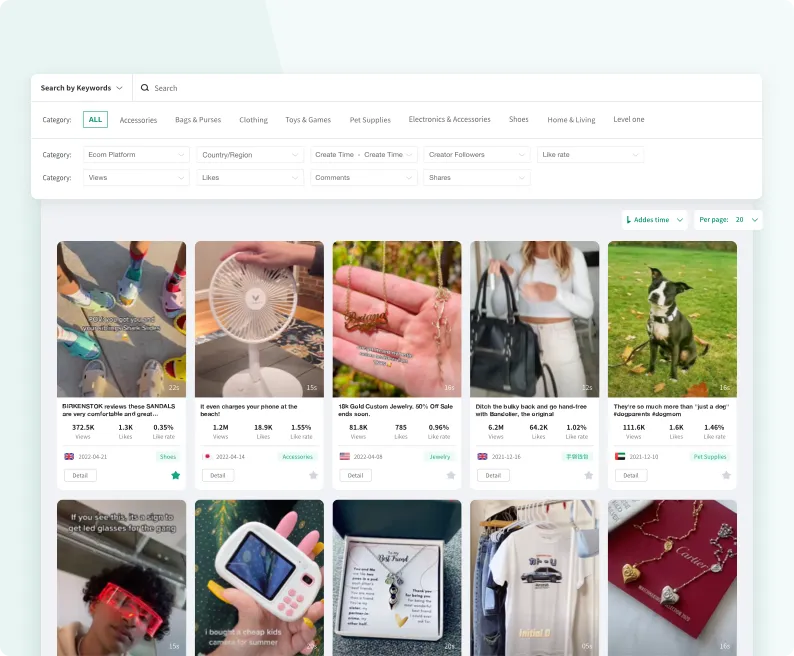
  • Get the Latest TikTok Shop Data.
Try It Free

How to Easily Analyze Facebook Ad Results With 3 Custom Reports

Published on: December 5 2022 by Social Media Examiner

Are you struggling to make sense of your Facebook ad campaigns? Are you finding it difficult to track and analyze the performance of your ads? If so, you're not alone. Many businesses struggle to analyze their Facebook ad results effectively. Fortunately, there's a solution: custom reports. In this article, we'll show you how to create three custom reports that will help you easily analyze your Facebook ad results.

Sub-Headings:

1. Understanding Custom Reports

2. Creating Custom Reports

3. Custom Report #1: Performance by Ad Placement

4. Custom Report #2: Performance by Ad Type

5. Custom Report #3: Performance by Audience

6. Using Custom Reports to Optimize Your Facebook Ads

7. Common Mistakes to Avoid

8. Conclusion

Understanding Custom Reports:

Before we dive into creating custom reports, let's first understand what they are. Custom reports are essentially customized views of your ad data. They allow you to choose the specific metrics and dimensions you want to see, and display them in a way that makes sense for your business. With custom reports, you can quickly identify trends and patterns in your ad data, and make data-driven decisions to optimize your campaigns.

Creating Custom Reports:

Creating custom reports in Facebook Ads Manager is relatively straightforward. Simply navigate to the Reports tab, click Customize Columns, and choose the metrics and dimensions you want to see. Once you've created your custom report, you can save it for future use or export it as a CSV file.

Custom Report #1: Performance by Ad Placement:

Ad placement is a crucial factor in the performance of your Facebook ads. By creating a custom report that shows the performance of your ads by placement, you can identify which placements are driving the most conversions and adjust your bidding strategy accordingly. Some metrics you may want to include in this report are:

- Placement (e.g., News Feed, Right Column, Audience Network)

- Impressions

- Clicks

- Cost per click (CPC)

- Conversions

- Cost per conversion (CPA)

Custom Report #2: Performance by Ad Type:

Different ad types perform differently, depending on the campaign objective and target audience. By creating a custom report that shows the performance of your ads by type, you can identify which ad types are driving the most engagement and adjust your creative strategy accordingly. Some metrics you may want to include in this report are:

- Ad type (e.g., Image, Video, Carousel)

- Impressions

- Clicks

- Click-through rate (CTR)

- Engagement (e.g., Likes, Comments, Shares)

- Cost per engagement (CPE)

Custom Report #3: Performance by Audience:

Your target audience is a critical factor in the success of your Facebook ad campaigns. By creating a custom report that shows the performance of your ads by audience, you can identify which audiences are driving the most conversions and adjust your targeting strategy accordingly. Some metrics you may want to include in this report are:

- Audience (e.g., Custom Audience, Lookalike Audience, Interest Targeting)

- Impressions

- Clicks

- Conversions

- Conversion rate

- Cost per conversion

Using Custom Reports to Optimize Your Facebook Ads:

Once you've created your custom reports, it's time to put them to use. Use the insights you gain from your custom reports to optimize your Facebook ad campaigns. For example, if you find that your ads perform better on mobile devices than on desktop, adjust your bidding strategy to focus more on mobile placements. Or, if you find that your video ads perform better than your image ads, adjust your creative strategy to create more video content.

Common Mistakes to Avoid:

While custom reports can be a powerful tool for analyzing your Facebook ad results, there are some common mistakes to avoid. For example, don't focus too much on vanity metrics like impressions or likes. Instead, focus on metrics that directly impact your business goals, such as conversions or revenue. Also, don't make changes to your campaigns based on a single custom report. Make sure to analyze your data from multiple angles to get a complete picture of your ad performance.

Analyzing Facebook ad results can be a daunting task, but with custom reports, it doesn't have to be. By creating custom reports that focus on specific metrics and dimensions, you can quickly identify trends and patterns in your ad data, and make data-driven decisions to optimize your campaigns. So, what are you waiting for? Start creating custom reports today and take your Facebook ad campaigns to the next level!

How to Easily Analyze Facebook Ad Results With 3 Custom Reports

Are you tired of wasting time trying to filter and sort data in Ads Manager? If so, these three custom reports can save you a boatload of time while measuring your Facebook ad results.

The ROI Snapshot Report:

- Best for conversion objective campaigns, such as generating sales or leads

- Requires Facebook Pixel installed and tracking correctly

- Customizable columns to view metrics like total and cost of checkouts initiated and website purchases

- Use to get a quick view of ad profitability

The Lead Progress Report:

- Builds on the ROI Snapshot Report

- Tracks cost per lead and leads in the sales funnel

- Customizable columns to view metrics like cost per link click and cost per checkout initiated

- Use to understand metrics at each stage of the funnel

The Engagement Report:

- Simple report to track ad-specific performance

- Customizable columns to view metrics like post engagement and video watch percentages

- Use to discover which type of content resonates with your audience

Using these custom reports, you can save time and make better ad buying decisions. Don't forget to share the reports with appropriate team members and check out other resources for deeper insights into metrics.

Start your free trial today!

Try Pipiads free for trial, no credit card required. By entering your email,
You will be taken to the signup page.