TIKTOK ADSPY TOOL
Discover Competitors' Ads and The Best Viral TikTok Products
-
 The biggest TikTok ads library & Most tiktok ads examples
-
#1 TikTok Ads Spy Tool
-
Viral TikTok Products & TikTok Top Ads
-
TikTok Shop Ad & TikTok Ad Targeting Audience
We analyze tens of millions of examples of tiktok ads
and discover the most viral tiktok products and videos every day
Everything you need for the best TikTok ads experience.
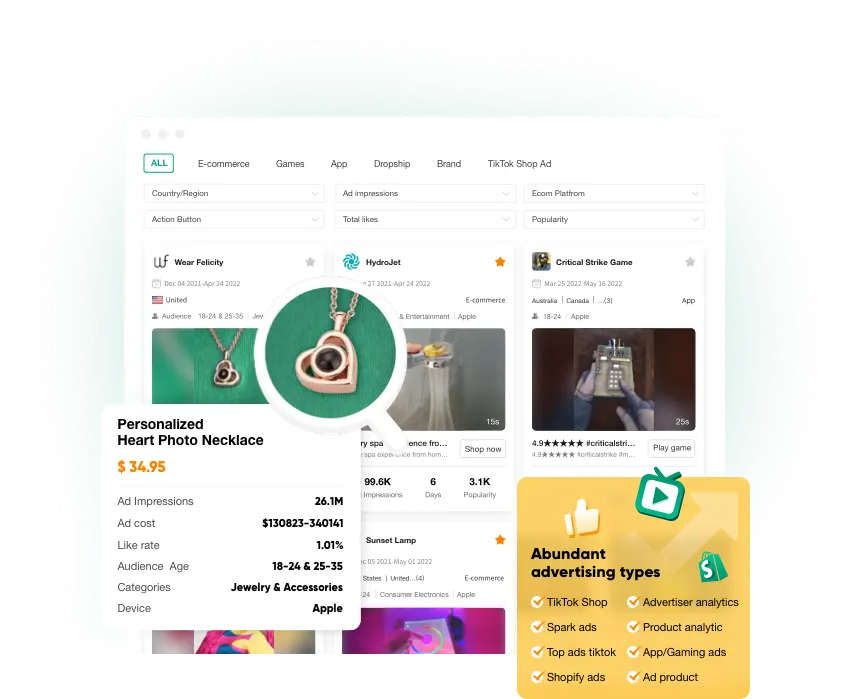
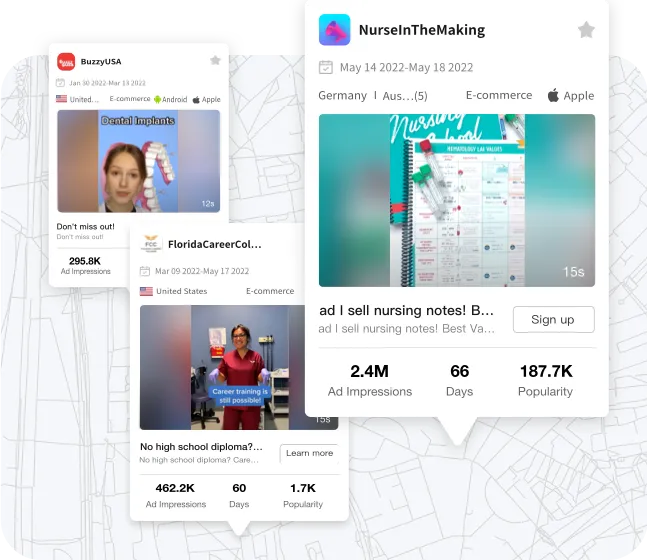
TikTok Ad Library
Find quality ads and products in a library of over 20 million TikTok ads.
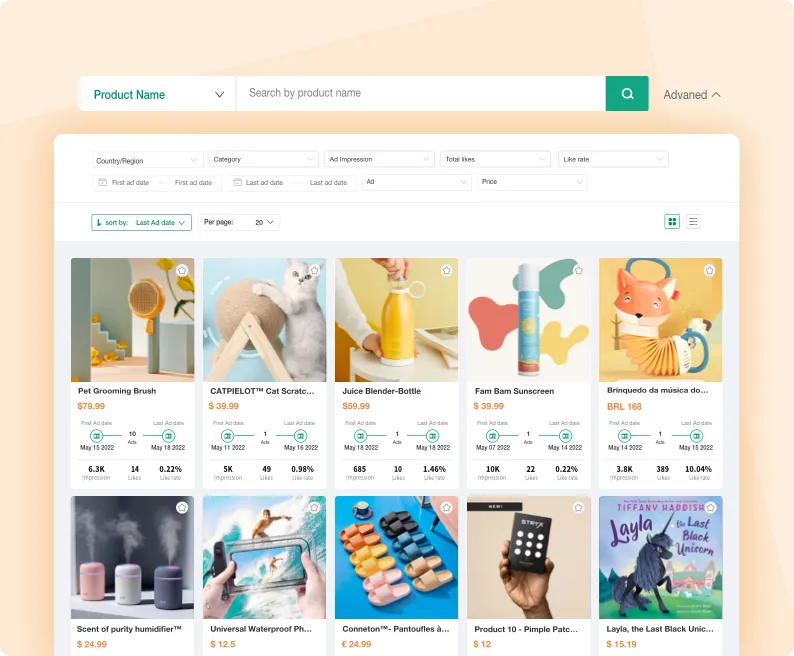
Winning Product
The best new winning products,every day! Find new winners with only a few clicks.

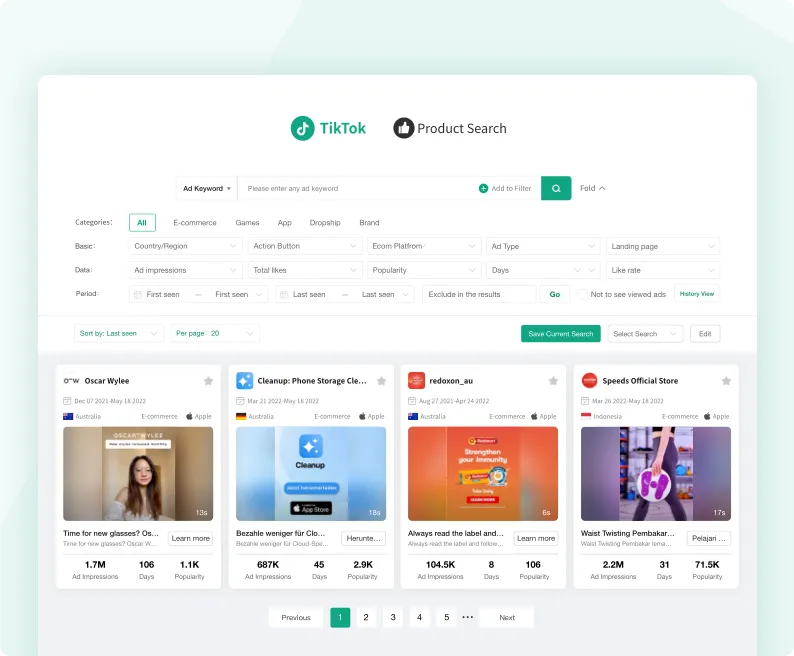
TikTok Ad Product
Find your perfect product. Find winning dropshipping products in minutes.
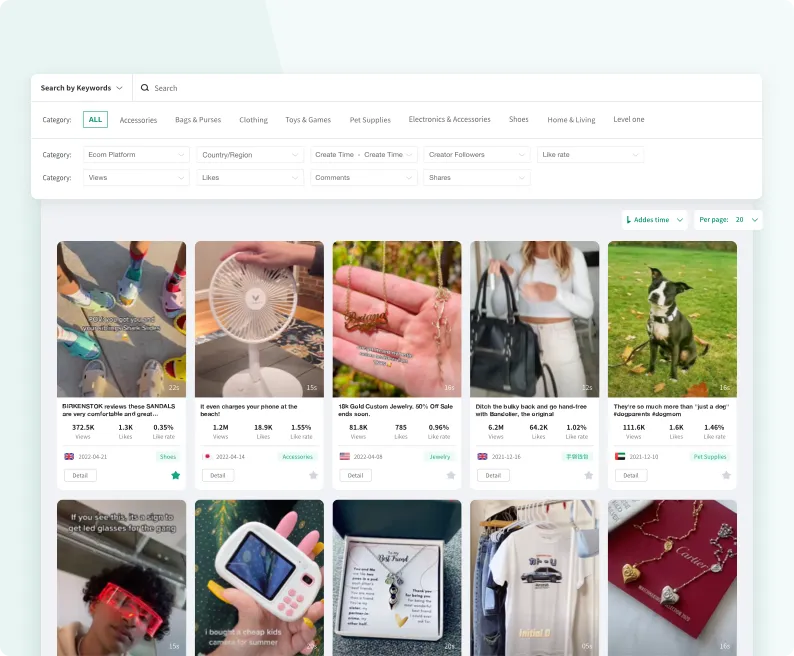
TikTok Trending Products
Stay up to date with TikTok product trends before they go viral,imagine being the first store to sell fidget spinners!
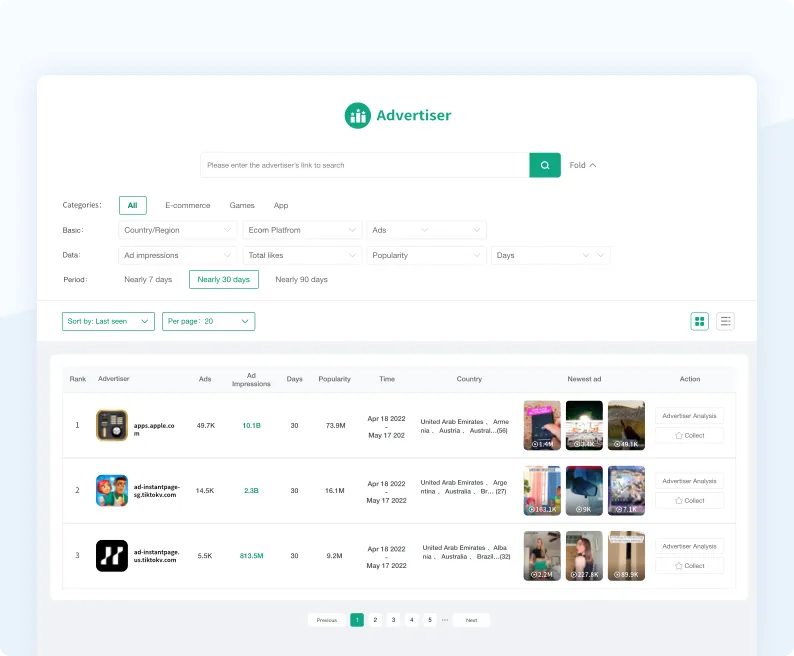
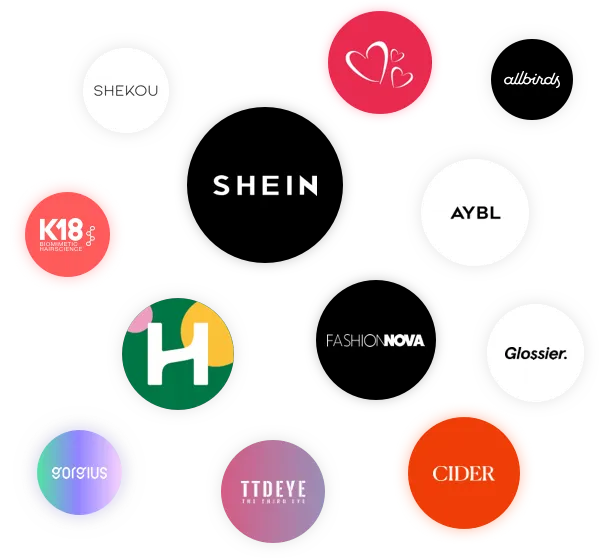
TikTok Advertiser
Discover great advertisers and learn about their well-performing TikTok ads, products, and stores.


What the best of them talk about us
NAZERATI
20.5K on Youtube
DEE DEE Ecom
6.5K on Youtube
Ethan Dobbins
7.4K on Youtube
Sharif Mohsin
98.2K on Youtube
Tomeck
2.8K on Youtube